Profit & Loss and Tenant Value Reports
Run a P&L by date range, and see which tenants are covering their allocated share of expenses.
Profit & Loss
Pick a From/To date range (defaults to the last 12 months) and click Apply. Three summary cards show Total Revenue, Total Expenses, and Net Income (shown in red if negative) for that range.
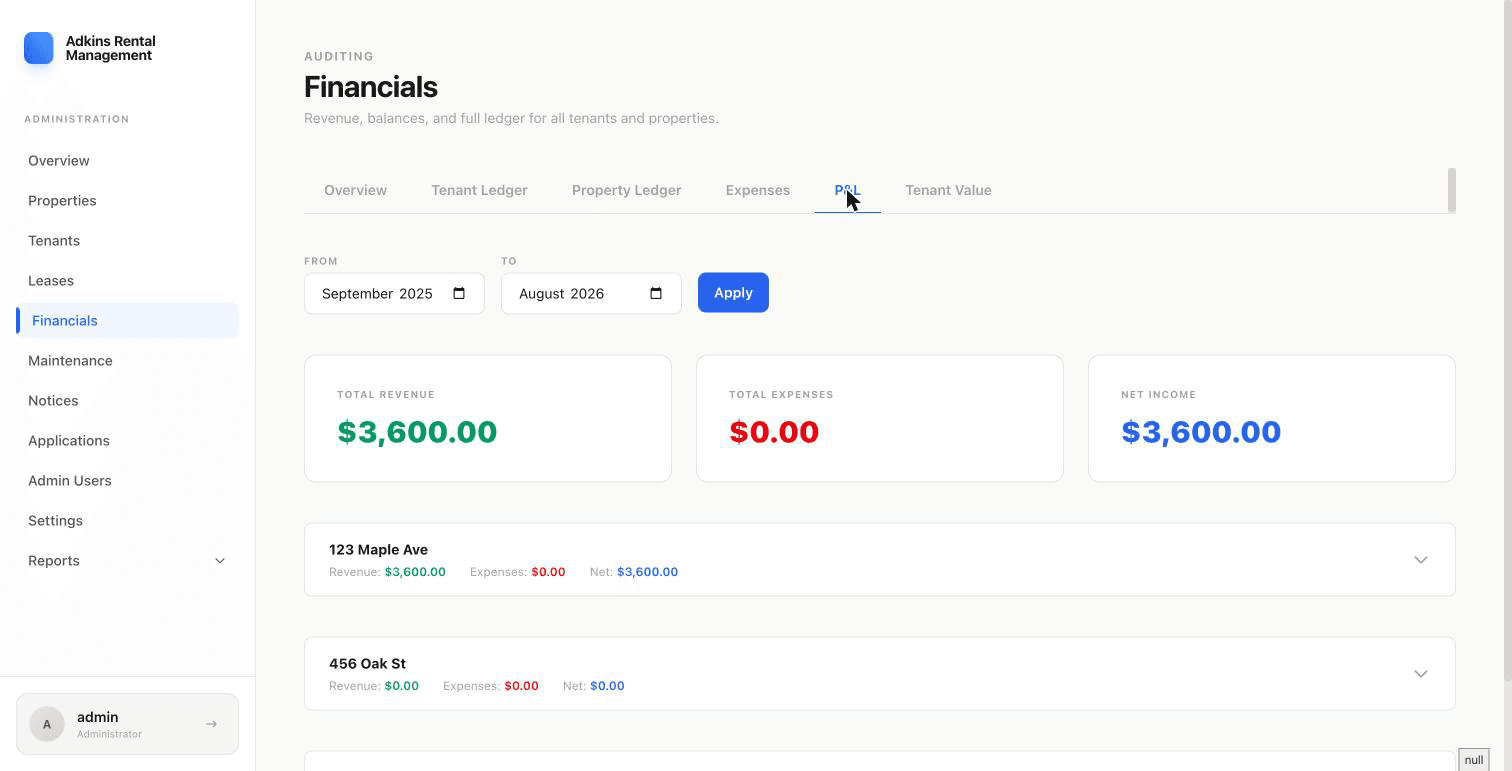
Below that, each property gets its own expandable row showing revenue/expenses/net at a glance, and expanding it reveals a monthly breakdown table plus an expense-by-category summary — useful at tax time or when a property owner asks "how did this one actually perform?"
Tenant Value
This report answers a different question: is each tenant's rent actually covering their share of expenses? It compares each tenant's revenue against their allocated expenses — their unit's own expenses in full, plus an even split of property-level expenses among however many tenants were active that month — and shows a ratio.
- Ratio ≥ 1.5x — comfortably covering their share (green).
- Ratio ≥ 1x — covering their share (light green).
- Ratio ≥ 0.5x — under their share (amber).
- Below 0.5x — well under (red); No data (gray) if there's nothing to calculate yet.
Click any row to open a full expense breakdown: unit-level expenses charged 100% to that tenant, and their calculated share of property-level expenses, month by month.